Adjustment of title, layout and position
Another headache issue you have with original legend is the difficulties to adjust title. Legendkit allows you to adjust alignment and title position easily.
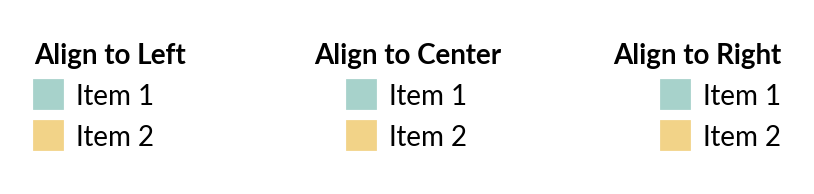
Alignment
>>> from legendkit import cat_legend
>>> _, ax = plt.subplots(figsize=(5, 1)); ax.set_axis_off()
>>> args = dict(
...     colors = ["#A7D2CB", "#F2D388"],
...     labels = ["Item 1", "Item 2"],
... )
>>> cat_legend(**args, title="Align to Left", alignment="left", loc="center left")
>>> cat_legend(**args, title="Align to Center", alignment="center", loc="center")
>>> cat_legend(**args, title="Align to Right", alignment="right", loc="center right")
Note
The alignment arguments is available in original legend for matplotlib >3.6
But you can use legendkit in lower version matplotlib.
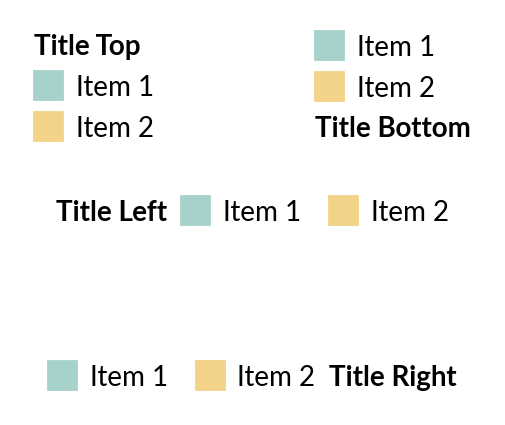
Title location
>>> _, ax = plt.subplots(figsize=(3, 2.5)); ax.set_axis_off()
>>> cat_legend(**args, title="Title Top", title_loc="top", loc="upper left")
>>> cat_legend(**args, title="Title Bottom", title_loc="bottom", loc="upper right")
>>> cat_legend(**args, title="Title Left", title_loc="left", loc="center", ncol=2)
>>> cat_legend(**args, title="Title Right", title_loc="right", loc="lower center", ncol=2)
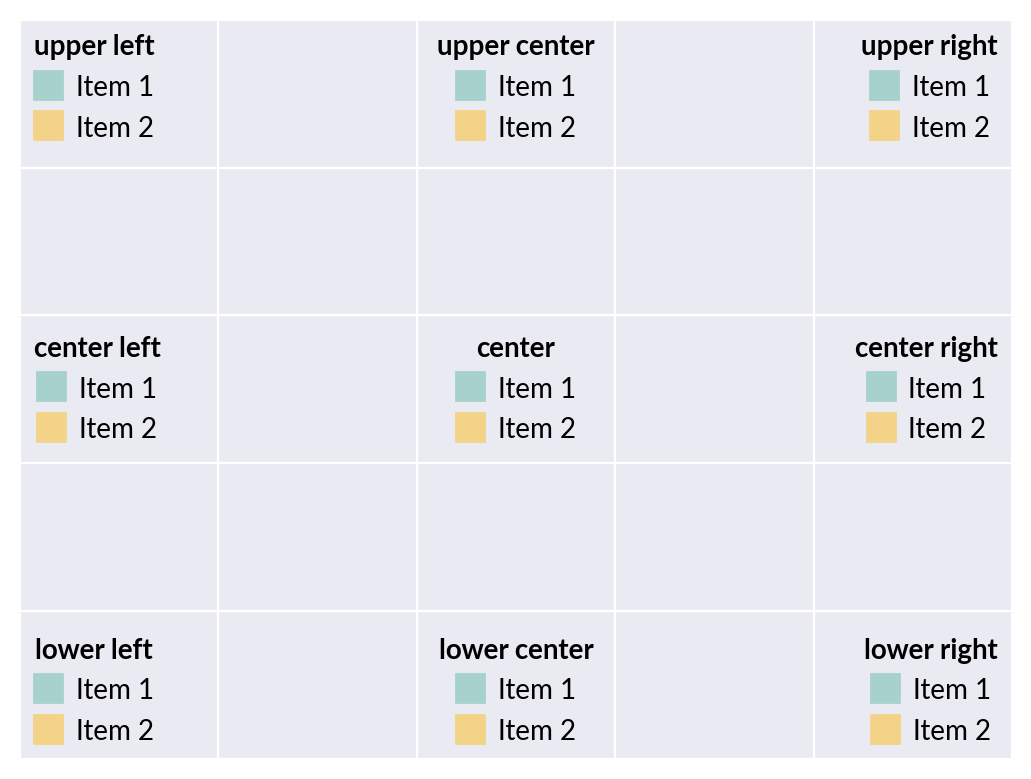
Legend Placement
In matplotlib, you can place legend inside the axes
>>> _, ax = plt.subplots(); ax.tick_params(labelleft=False, labelbottom=False)
>>> locations = [
...     "upper left", "upper center", "upper right",
...     "center left", "center", "center right",
...     "lower left", "lower center", "lower right",
... ]
>>> for loc in locations:
...     cat_legend(**args, title=loc, loc=loc, alignment="center")
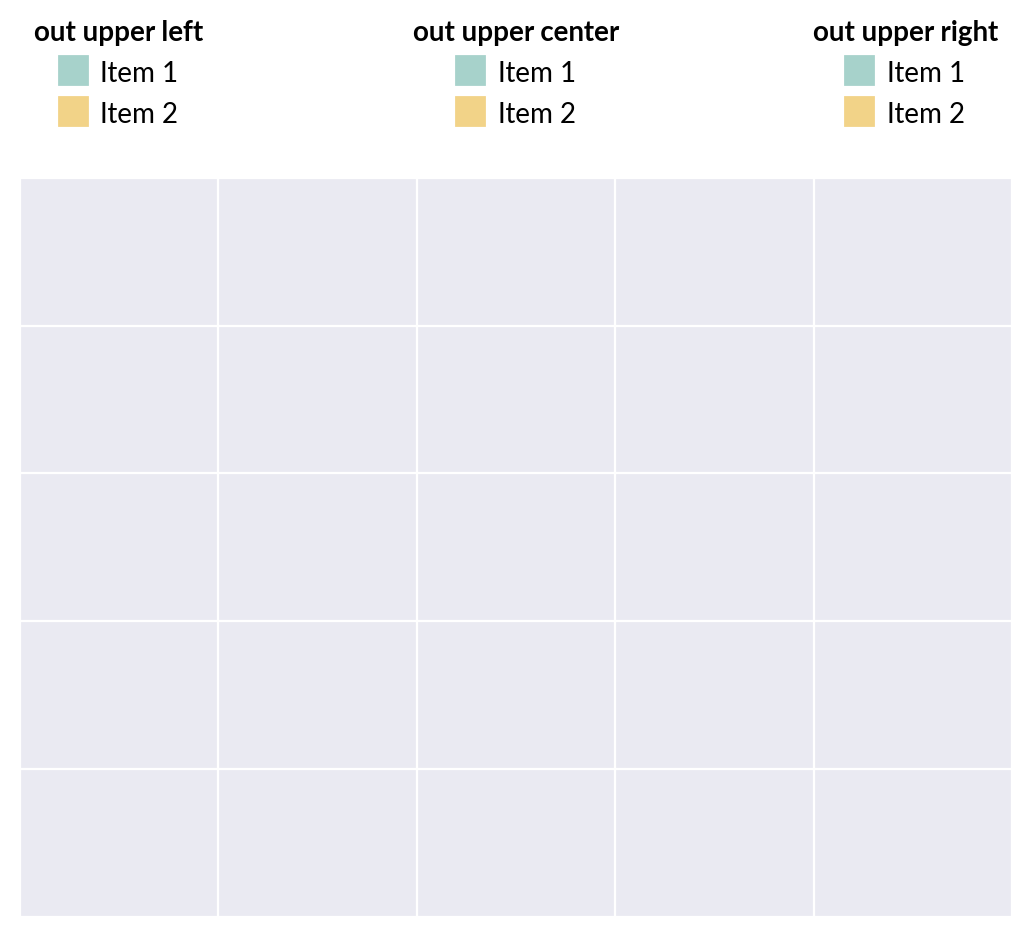
Location in matplotlib
Apart from default locations support by matplotlib, we offer you extra location options to place your legend outside the axes to avoid overlap. All options start with out, the second word is the side of axes to put the legend, the third word is the position. You can use deviation to control the gap between legend and your axes.
>>> _, ax = plt.subplots(); ax.tick_params(labelleft=False, labelbottom=False)
>>> locations = [
...     "out upper left", "out upper center", "out upper right",
...     "out lower left", "out lower center", "out lower right",
...     "out left upper", "out left center", "out left lower",
...     "out right upper", "out right center", "out right lower",
... ]
>>> for loc in locations:
...     cat_legend(**args, title=loc, loc=loc, alignment="center", deviation=0.05)
Extra location in legendkit
Note
When you place legend outside of axes, please use bbox_inches=’tight’ or set the mpl.rcParams[‘savefig.bbox’] = ‘tight’ to avoid the legend gets clipped out.