Make a Legend
Use it as the same old way
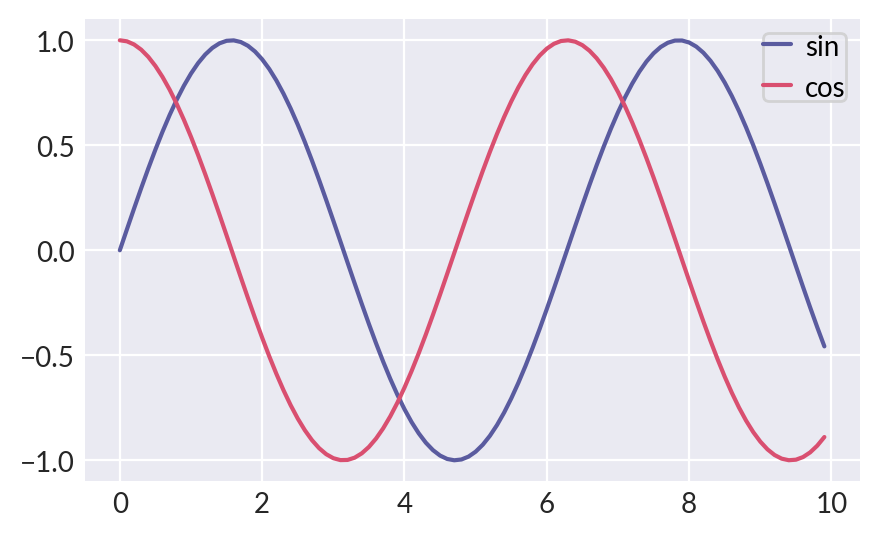
Most of the time, you call .legend method to create legend in matplotlib.
>>> _ = plt.figure(figsize=(5, 3))
>>> x = np.arange(0, 10, 0.1)
>>> plt.plot(x, np.sin(x), label="sin")
>>> plt.plot(x, np.cos(x), label="cos")
>>> plt.legend()
For legendkit, you can do similar thing:
>>> from legendkit import legend
>>> _ = plt.figure(figsize=(5, 3))
>>> plt.plot(x, np.sin(x), label="sin")
>>> plt.plot(x, np.cos(x), label="cos")
>>> legend()

Create semantic legend
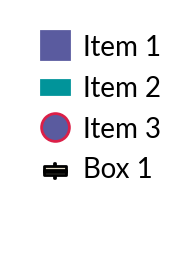
A powerful feature of legendkit is to create legend semantically. I think many of the time you find calling the legend can’t really satisfy your need. You can easily declare a legend entry by specifying its handle and label. It’s possible to customize the handles by supplying more styles to it.
>>> _, ax = plt.subplots(figsize=(1, 1.5)); ax.set_axis_off()
>>> legend_items = [
...     ('square', 'Item 1'), # use default style
...     ('rect', 'Item 2', dict(color='#01949A')),
...     ('circle', 'Item 3', dict(ec='#DB1F48', lw=1.5)),
...     ('boxplot', 'Box 1', dict(fc='#E5DDC8')),
... ]
>>> legend(legend_items=legend_items)
Note
For current supported semantic legend handles: see legendkit.legend()
Create legend with handlers
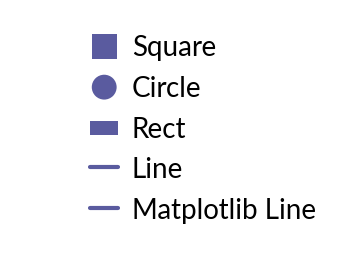
You can also use matplotlib legend handlers for richer definition.
Legendkit provides you with predefined handlers to use out of the box.
The SquareItem will ensure square shape not matter how handle sizes are changed.
The RectItem will ensure the rectangle shape even when handle sizes are the same.
The LineItem is just a proxy to Line2D.
If you want to use highly customized element as entry, you can check Implementing a custom legend handler
>>> from legendkit.handles import SquareItem, CircleItem, RectItem, LineItem
>>> from matplotlib.lines import Line2D
>>> _, ax = plt.subplots(figsize=(2, 1.5)); ax.set_axis_off()
>>> legend(
...   handles=[SquareItem(), CircleItem(), RectItem(), LineItem(), Line2D([], [])],
...   labels=['Square', 'Circle', 'Rect', 'Line', 'Matplotlib Line'],
... )
Preset Legend
Legendkit offer you with some commonly used legend. So you don’t need to configure it over and over again.
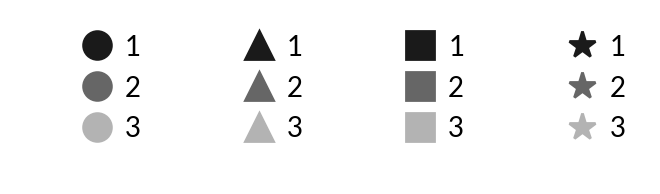
>>> from legendkit import cat_legend
>>> _, axes = plt.subplots(1, 4, figsize=(4, 1))
>>> for handle, ax in zip(["circle", "triangle", "square", "star"], axes):
...     ax.set_axis_off()
...     cat_legend(ax=ax, colors=[".1", ".4", ".7"], labels=["1", "2", "3"], handle=handle)
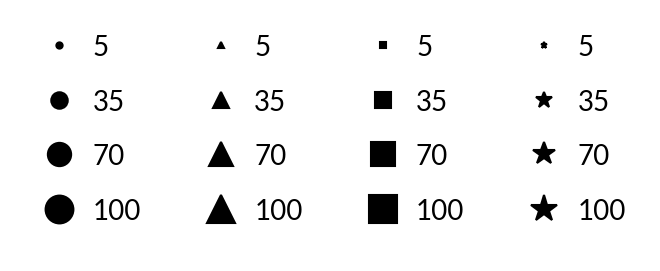
>>> from legendkit import size_legend
>>> _, axes = plt.subplots(1, 4, figsize=(4, 1.5))
>>> for handle, ax in zip(["circle", "triangle", "square", "star"], axes):
...     ax.set_axis_off()
...     size_legend(sizes=np.arange(1, 101, 1), handle=handle, ax=ax)
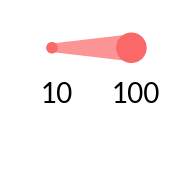
>>> from legendkit import paired_size_legend
>>> _, ax = plt.subplots(figsize=(1, 1)); ax.set_axis_off()
>>> paired_size_legend(sizes=[10, 100], color="#FA6868", ax=ax)