legendkit.legend
- class legendkit.legend(ax: Axes | FigureBase = None, legend_items=None, handles=None, labels=None, title_loc='top', alignment=None, titlepad=0.5, draw=True, handler_map=None, loc=None, deviation=0.05, bbox_to_anchor=None, bbox_transform=None, frameon=False, fontsize=None, prop=None, handleheight=None, handlelength=None, **kwargs)
This is a modified legend based the original matplotlib class
- List of sementic legend handle to be used:
rect
circle
square
line
boxplot
triangle (triangle-up, triangle-down, triangle-left, triangle-right)
diamond
octagon
pentagon
hexagon
star
plus
cross
asterisk
The markers in
matplotlib.markers
- Parameters:
- ax
AxesorFigure The axes to draw the legend
- legend_itemsarray-like of (handle, label, styles)
See examples
- handlesarray-like
A list of legend handler
- labelsarray-like
A list of legend labels
- title_loc{‘top’, ‘bottom’, ‘left’, ‘right’}
The location of title
- alignment{‘top’, ‘bottom’, ‘left’, ‘right’, ‘center’}, default: ‘left’
How to align the whole legendbox, if title is placed on top or bottom, default is ‘left’; if title is placed on left and right, default is ‘center’;
- titlepadfloat
The space between title and legend entries
- drawbool
Whether to draw the legend
- handler_mapdict
- locstr
Apart from the default location code, you can add ‘out’ as prefix to place the legend ouside the axes. See all available options.
- deviationfloat
The space between legend and axes if legend is placed ouside axes.
- frameonbool, default: False
Draw a frame around legend. Legendkit will not show frame by default
- kwargs
For other paramters, please see
Legend
- ax
Examples
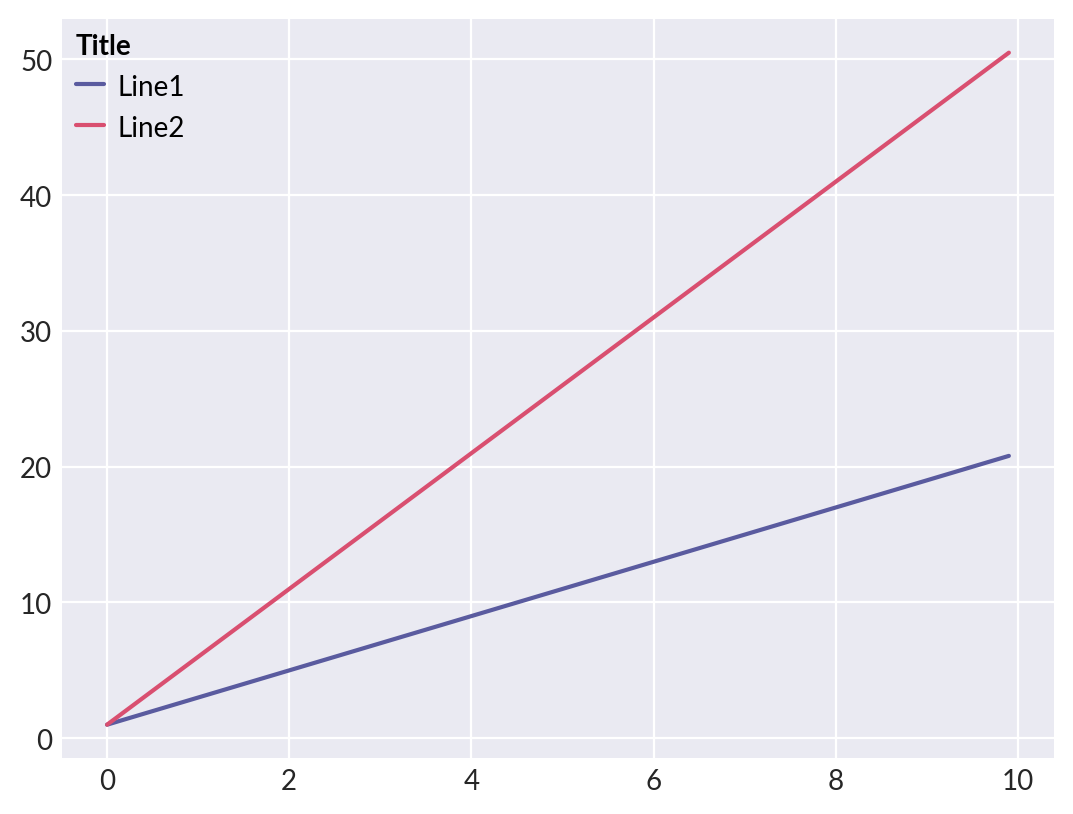
Create legend from existing axes
>>> from legendkit import legend
>>> x = np.arange(0, 10, 0.1)
>>> _, ax = plt.subplots()
>>> ax.plot(x, 2*x + 1, label="Line1")
>>> ax.plot(x, 5*x + 1, label="Line2")
>>> legend(ax, title="Title", alignment="left")
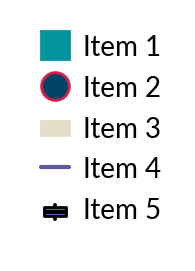
Create legend semantically
>>> _, ax = plt.subplots(figsize=(1, 1.5))
>>> ax.set_axis_off()
>>> legend(ax, legend_items=[
...     # (handle, label, styles)
...     ('square', 'Item 1', {'color': '#01949A'}),
...     ('circle', 'Item 2', {'facecolor': '#004369',
...                           'edgecolor': '#DB1F48'}),
...     ('rect', 'Item 3', {'color': '#E5DDC8'}),
...     # Or you can have no config at all
...     ('line', 'Item 4'),
...     ('boxplot', 'Item 5'),
... ])